Problem diagnosis procedures
The Diagnosis Procedures are the first steps that a System Administrator will take to locate the source of an error in Orion. Once the nature of the error is identified with these tests, the system admin will often have to resort to more concrete and specific testing to pinpoint the exact point of failure and a possible solution. Such specific testing is out of the scope of this section.
Please report any bug or problem with Orion Context Broker by opening and issue in github.com.
Resource Availability
Although we haven't done yet a precise profiling on Orion Context Broker, tests done in our development and testing environment show that a host with 2 CPU cores and 4 GB RAM is fine to run the ContextBroker and MongoDB server. In fact, this is a rather conservative estimation, Orion Context Broker could run fine also in systems with a lower resources profile. The critical resource here is RAM memory, as MongoDB performance is related to the amount of available RAM to map database files into memory.
Remote Service Access
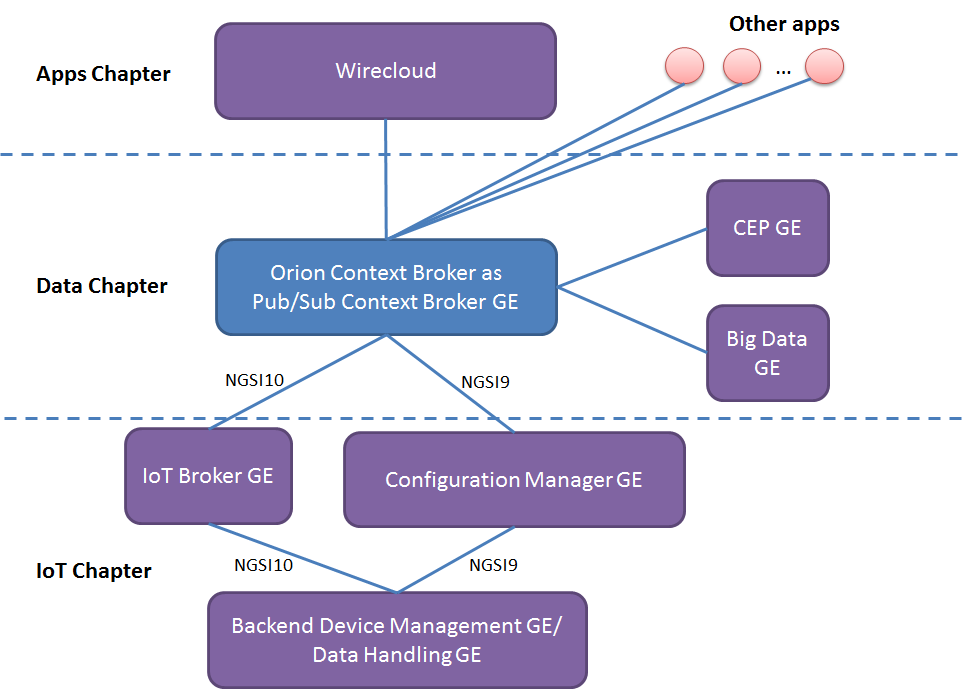
Orion Context Broker can run "standalone", thus context consumer and context producers are connected directly to it through its NGSI interface. Thus, it is loosely coupled to other FIWARE GEs. However, considering its use in the FIWARE platform, below is a list of the GEs that typically can be connected to the broker:
It typically connects to the IoT Broker GE and ConfMan GE (from IoT chapter GEs), other GEs within the Data Chapter (such as CEP or BigData) and GEs from the Apps chapter (such as Wirecloud). As an alternative, the IoT Broker GE and ConfMan GE could be omitted (if the things-to-device correlation is not needed) thus connecting Orion Context Broker directly to the Backend Device Management GE or to the DataHandling GE.

Resource consumption
The most usual problems that Orion Context Broker may have are related to abnormal consumption of memory due to leaks and disk exhaustion due to growing log files.
Regarding abnormal consumption of memory, it can be detected by the the following symptoms:
- The broker crashes with a "Segmentation fault" error
- The broker doesn't crash but stops processing requests, i.e. new
requests "hang" as they never receive a response. Usually, the Orion
Context Broker has only a fix set of permanent connections in use as
shown below (several ones with the database server and notification receivers and the listening
TCP socket in 1026 or in the port specified by "-port") but in the
case of this problem each new request will appear as a new
connection in use in the list. The same information can be checked
using
ps axo pid,ppid,rss,vsz,nlwp,cmdand looking to the number of threads (nlwp column), as a new thread is created per request but never released. In addition, you can check the broker log and see that the processing of new requests stops in the access to the MongoDB database (in fact, what is happening is that the MongoDB driver is requesting more dynamic memory to the OS but it doesn't get any and keeps waiting until some memory gets freed, which never happens).
$ sudo lsof -n -P -i TCP | grep contextBr
contextBr 7100      orion    6u  IPv4 6749369      0t0  TCP 127.0.0.1:45350->127.0.0.1:27017 (ESTABLISHED)
[As many connections to "->127.0.0.1:27017" as DB pool size, default value is 10]
[As many connections as subscriptions using persistent connections for notifications]
contextBr 7100      orion    7u  IPv4 6749373      0t0  TCP *:1026 (LISTEN)
- The consumption of memory shown by "top" command for the contextBroker process is abnormally high.
The solution to this problem is restarting the contextBroker, e.g.
/etc/init.d/contextBroker restart.
Regarding disk exhaustion due to growing log files, it can be detected by the following symptoms:
- The disk is full, e.g.
df -hshows that the space available is 0% - The log file for the broker (usually found in the directory /var/log/contextBroker) is very big
The solutions for this problem are the following:
- Stop the broker, remove the log file and start the broker again
- Configure log rotation
- Reduce the log verbosity level, e.g. if you are using
-t 0-255the log will grow very fast so, in case of problems, please avoid using unneeded trace levels.
Diagnose file descriptors exhaustion problems
The symptoms of this problem are:
- Orion Context Broker is having problems managing network connections, e.g. incoming connections are not handled and/or notifications cannot be sent.
- You are using threadpool notification mode (in theory it could happen in other notification modes, but it is highly improbable).
- The number of file descriptors used by Orion is close to the operating
system limit (i.e.
ulimit -n). In order to get the number of used file descriptors by a given process the following command can be used:
lsof -p <pid> | wc -l
The solution to the problem is to ensure that Orion is properly configured in order
for the inequity described in threadpool considerations
to hold. Alternatively, the operating system limit could be raised with
ulimit -n <new limit>.
Diagnose spontaneous binary corruption problems
The symptoms of this problem are:
- Orion Context Broker send empty responses to REST requests (e.g. with curl the message is typically "empty response from server"). Note that it could happen that request on some URLs work normally (e.g. /version) while in others the symptom appears.
- The MD5SUM of /usr/bin/contextBroker binary (that can be get with "md5sum /usr/bin/contextBroker" is not the right one (check list for particular versions at the end of this section).
- The prelink package is installed (this can be checked running the command "rpm -qa | grep prelink")
The cause of this problem is prelink, a program that modifies binaries to make them starting faster (which is not very useful for binary implementing long running services as contextBroker is) but that is known to be incompatible with some libraries (in particular, it seems to be incompatible with some of the libraries used by Context Broker).
The solution fo this problems is:
- Disable prelink, either implementing one of the following
alternatives:
- Remove the prelink software, typically running (as root or using
sudo):
rpm -e prelink - Disable the prelink processing of contextBroker binary, creating the /etc/prelink.conf.d/contextBroker.conf file with the following content (just one line)
- Remove the prelink software, typically running (as root or using
sudo):
-b /usr/bin/contextBroker
- Re-install the contextBroker package, typically running (as root or using sudo):
yum remove contextBroker
yum install contextBroker
I/O Flows
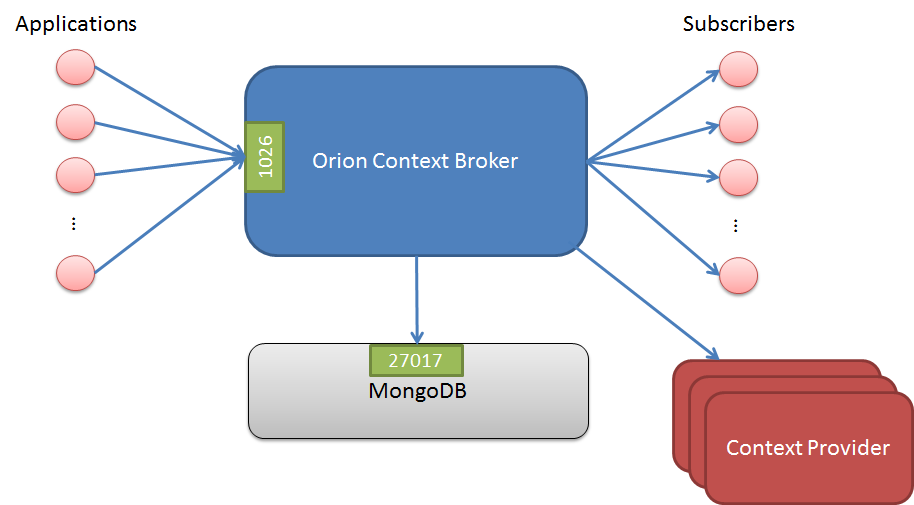
The Orion Context Broker uses the following flows:
- From NGSI9/10 applications to the broker, using TCP port 1026 by default (this is overridden with "-port" option).
- From the broker to subscribed applications, using the port specified by the application in the callback at subscription time.
- From the broker to MongoDB database. In the case of running MongoDB in the same host as the broker, this is an internal flow (i.e. using the loopback interface). The standard port in MongoDB is 27017 although that can be changed in the configuration. Intra-MongoDB flows (e.g. the synchronization between master and slaves in a replica set) are out of the scope of this section and not shown in the picture.
- From the broker to registered Context Providers, to forward query and update requests to them.
Note that the throughput in these flows can not be estimated in advance, as it depends completely on the amount of external connections from context consumer and producers and the nature of the requests issued by consumers/producers.

Diagnose database connection problems
The symptoms of a database connection problem are the following ones:
- At start time. The broker doesn't start and the following message appears in the log file:
X@08:04:45 main[313]: MongoDB error
- During broker operation. Error message like the following ones appear in the responses sent by the broker.
    ...
    "errorCode": {
        "code": "500",
        "reasonPhrase": "Database Error",
        "details": "collection: ... - exception: Null cursor"
    }
    ...

    ...
    "errorCode": {
        "code": "500",
        "reasonPhrase": "Database Error",
        "details": "collection: ... - exception: socket exception [CONNECT_ERROR] for localhost:27017"
    }
    ...

    ...
    "errorCode": {
        "code": "500",
        "reasonPhrase": "Database Error",
        "details": "collection: ... - exception: socket exception [FAILED_STATE] for localhost:27017"
    }
    ...

    ...
    "errorCode": {
        "code": "500",
        "reasonPhrase": "Database Error",
        "details": "collection: ... - exception: DBClientBase::findN: transport error: localhost:27017 ns: orion.$cmd query: { .. }"
    }
    ...
In both cases, check that the connection to MonogDB is correctly configured (in particular, the BROKER_DATABASE_HOST if you are running Orion Context Broker as a service or the "-dbhost" option if you are running it from the command line) and that the mongod/mongos process (depending if you are using sharding or not) is up and running.
If the problem is that MongoDB is down, note that Orion Context Broker is able to reconnect to the database once it gets ready again. In other words, you don't need to restart the broker in order to re-connect to the database.